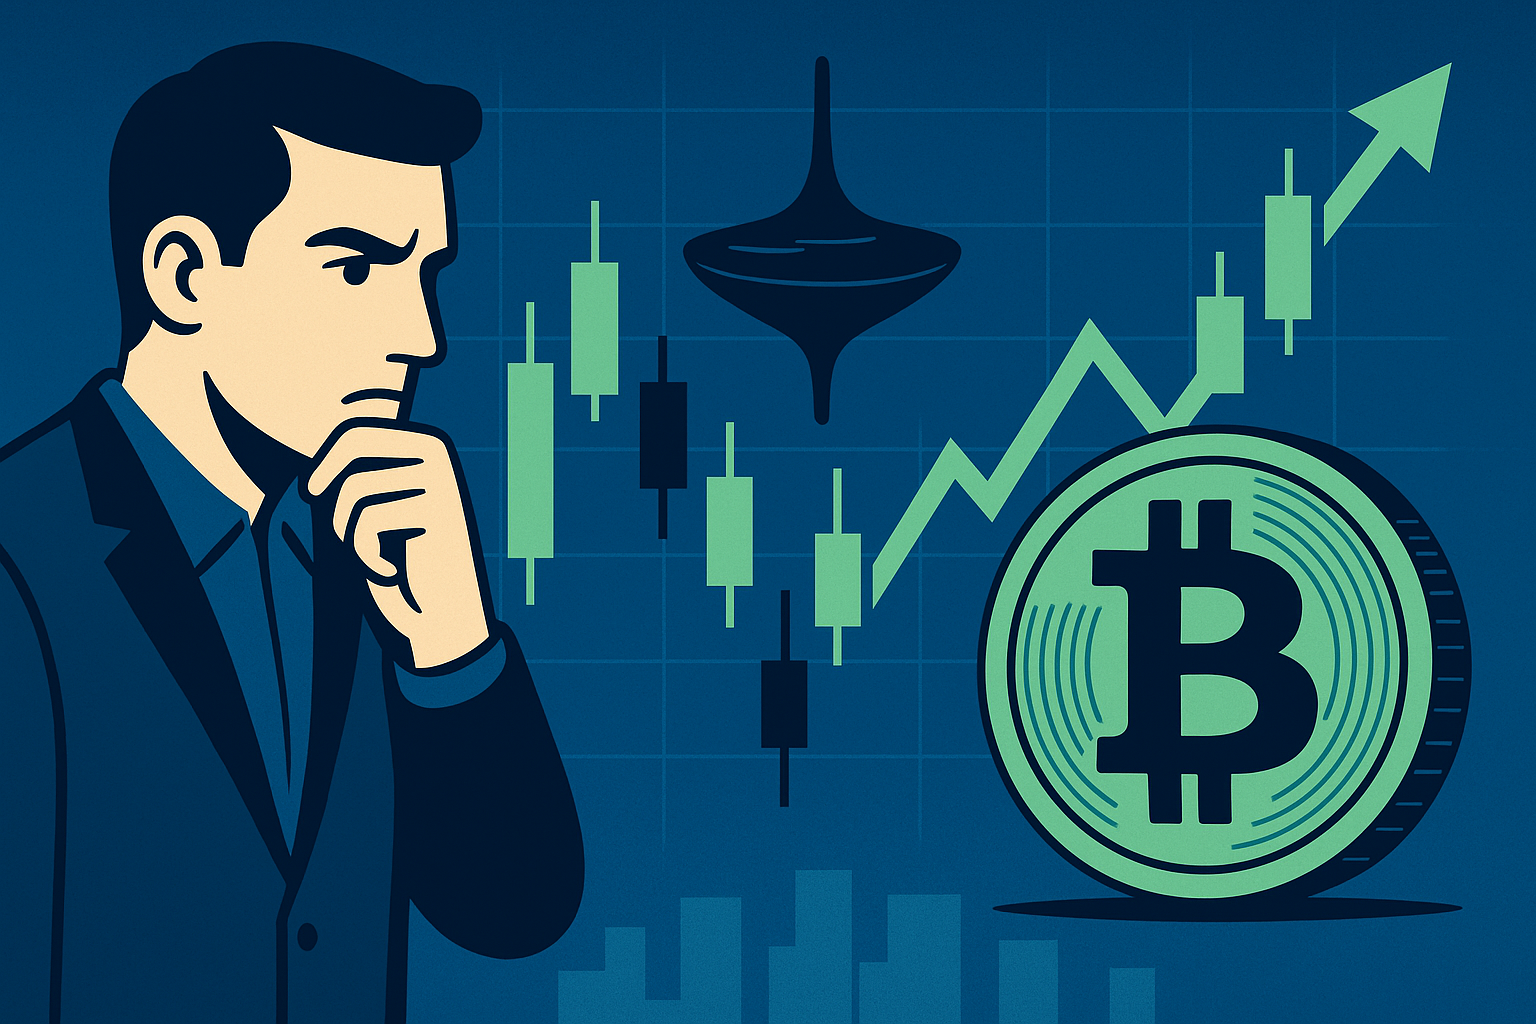
While traders were sleeping—okay, you might've been doom-scrolling TikTok at 2 a.m.—Bitcoin quietly printed the highest monthly close in its 15-year life: $107,100. If you're shaking your head because that number still looks surreal after the sub-$20K days of 2022, trust me, you're not alone. But here’s the curveball: the candle that sealed the deal is a textbook spinning top. That’s TA-speak for, “the market’s pumped, but it’s also scratching its head.”
Here’s What Actually Happened
June’s final four-hour stretch saw roughly $2.3 billion in BTC swap hands on Binance, Coinbase, and the usual suspects. According to Glassnode, whale wallets (those chunky 1,000+ BTC addresses) added a net 18,600 coins in the last 48 hours of the month. Yet the candle’s body—the gap between open and close—was barely $500 wide, and both wicks stretched more than $3K up and down. That, folks, is your spinning top: plenty of volume, zero conviction.
Spinning Tops 101 (in Plain English)
Think of a spinning top candlestick like a tennis ball teetering on the net. It could fall on either side, but for a tantalizing second it just balances there, making everyone in the stadium gasp. Historically, on BTC’s weekly chart at least, spinning tops around an ATH zone have meant either a quick 8-10% pop or a 12-15% shake-out. Trader @RookieXBT DM’d me—yes, the guy who only tweets in memes—and summed it up:
“We’re at the part of the roller coaster where the cart clicks upward and you wonder if the safety bar’s actually locked.”
Why the 9 % Rally Call Isn’t as Random as It Sounds
The analyst in question is veteran quant Thomas Fahrer over at Apollo Crypto, the Sydney-based hedge fund that loves scatter plots. His thesis is basically three bullet points:
- BTC just broke out of a four-month ascending triangle on the daily chart—target sits at roughly $117K (yup, that’s ~9% from here).
- Open interest on CME futures dropped 6 % during the close—meaning leveraged shorts unwound while price didn’t fall.
- The U.S. core PCE print came in at 2.6 %, its lowest since March 2021, and the algo desks are pricing maybe two Fed cuts by December.
In plain English: less macro drag, fewer shorts, and a chart pattern that—in Fahrer's words—"points up and to the right like Silicon Valley revenue projections." Could he be wrong? Definitely. But at least he’s got data points instead of hopium.
Under the Hood: Network Health Check
If you’ve ever wondered how devs gauge Bitcoin’s heartbeat, it’s basically two vital signs: hash rate and fees per byte. Right now, hash rate is lounging at 633 EH/s, off the post-halving peak but still miles above 2023 averages. As for fees, they’ve cooled to sub-3 sat/byte; that’s why your Lightning channel opens aren’t costing an arm lately. In other words, the plumbers keeping this cyber-plumbing humming aren’t freaking out.
I pinged Mempool.Space maintainer Wiz—he sent back a single emoji: 🥱. Translation: mempool’s empty, miners are comfy, and any price fireworks are happening on the trading layer, not the base layer.
But Wait, Didn’t ETFs Top-Tick the Market?
Remember January’s spot-ETF launch? Feels like a lifetime ago. BlackRock’s IBIT has now hoovered up 308,000 BTC, roughly 1.46 % of all supply. Yet inflows stalled in May, leading to the doom takes that Larry Fink had already rung the bell. Fun fact: June flows turned positive again—$1.2 billion net—right as BTC was lifting from $96K to six figures. Coincidence? Maybe. But when TradFi buying synchronizes with on-chain whale accumulation, I’m not inclined to fade it.
This Isn’t 2017, and That’s Both Good and Weird
Quick nostalgia break: in 2017, Korean mom-and-pop accounts on Bithumb were paying a 20 % kimchi premium for coins, and the turn-of-the-year top was a vertical spike. Today’s climb looks more like a staircase—with the occasional missing step that trips everyone. The stair-builder is largely institutional: OTC desks like Cumberland, liquidity providers like Wintermute, and yes, the ETF crowd. Volatility is lower—BitVol is sitting at 53.2 compared to 91 in late 2020. That’s why even a spinning top at ATH isn’t instant panic; the market structure’s fundamentally different.
Tangent Alert: ETH Gas Fees and the Whole Risk-On Narrative
If gas on Ethereum stays under 7 gwei while BTC is flirting with price-discovery territory, does that mean everyone’s risk-off? I’m not sure. What I do know is that the memecoin casino shifting to Solana has freed up blockspace elsewhere, and some funds are rotating back into BTC as a " safer growth " trade (yes, that phrase made me chuckle too). The cross-chain capital flows matter because Bitcoin dominance has nudged from 52 % to 54.8 % in the last six weeks. That’s subtle but tells you rotational energy favors digital gold, not the shiny new Layer-3 flavor of the month.
Okay, So What’s a Reasonable Plan Here?
If you’re a long-term HODLer, nothing about a spinning top at $107K should break your stride. Your DCA script on Swan or Coinbase Advanced can keep humming. If you’re a swing trader, set alarms around $103K (support) and $111K (resistance). And if you’re using perps on Bybit with 25× leverage—buddy, maybe consider touching grass.
Tools I’m watching: TensorCharts for real-time aggregated order books, LookIntoBitcoin for the Pi-Cycle top indicator (it’s flashing orange but not red), and good old TradingView on the Heikin-Ashi setting—because sometimes regular candles just feel like visual noise.
Why This Matters for Your Portfolio
Macro backdrop, network fundamentals, and institutional flows are all sliding into a halfway decent alignment. Could a black swan appear? Always. Mt. Gox creditors finally receive coins in July. That’s about 140,000 BTC that could, in theory, spook the market. On the flip side, most of that supply is already hedged via futures, according to K33 Research. Net effect might end up a lot smaller than the headlines will scream.
One more angle: the halving-to-ATH lag averaged 220 days in the last two cycles. We’re 78 days post-halving right now. If history rhymes even loosely, the next six months are still in the “accumulation with mood swings” window rather than final blow-off top. Keep that mental model handy next time the chart prints a scary red daily candle.
My Two Satoshis
I’ll admit, the spinning top gave me pause. I even toyed with trimming my stack—then I opened up the on-chain dashboards and saw miner flows hitting multi-year lows. When the guys with the highest OpEx can’t be bothered to sell, I relax a little. Could we dip to sub-$100K before blasting higher? Absolutely. Will that ruin the long-term story? Not to me.
Final thought: the mainstream press finally stopped asking “is Bitcoin dead?” and started asking “should Bitcoin be in my pension fund?” That psychological shift, more than any candlestick pattern, tells me the next decade’s trajectory.
Catch you in the mempool. 🔥🧡


