If you’d told me back in March 2020—when I was panic-refreshing the Johns Hopkins Covid dashboard and wondering whether grocery stores would ever stock toilet paper again—that Bitcoin would rip 1,700% in the next 20 months, I would’ve laughed and thrown another can of beans into the cart. Yet here we are, and I’m getting the same weird déjà-vu vibe this week.
Here's What Actually Happened
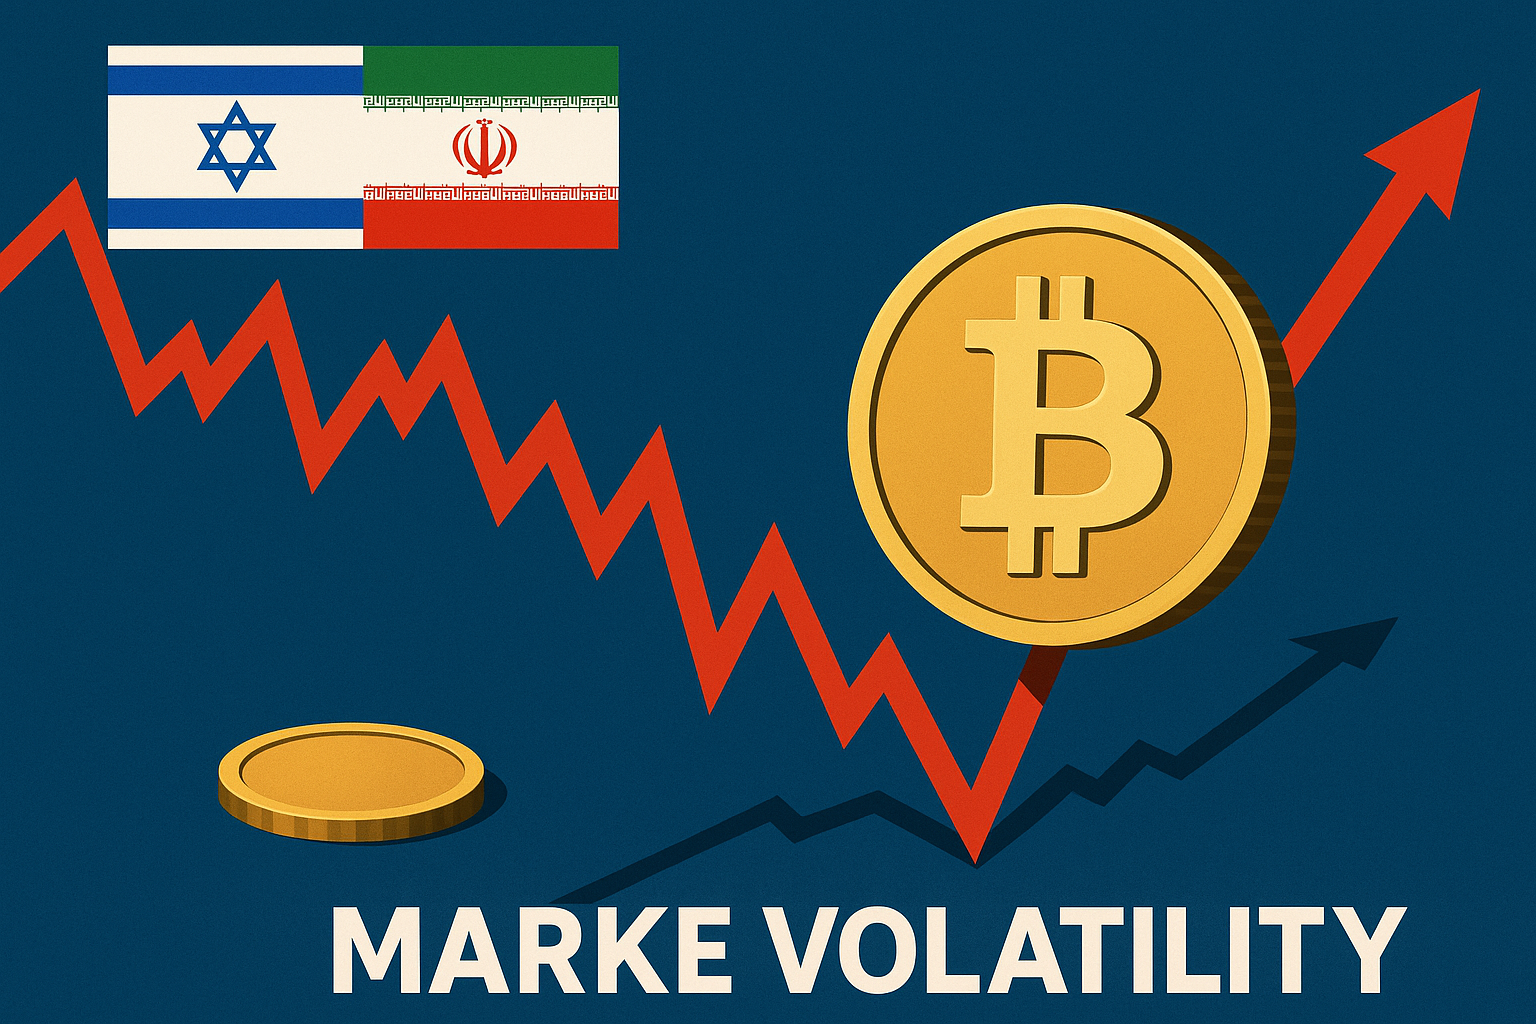
Late Thursday night, while most of you (and honestly, me too) were doom-scrolling the Iran-Israel headlines, BTC slipped on an invisible banana peel. The price dumped roughly 7% in a few hours—$67,200 down to $62,400—its sharpest single-day red candle since the ETF launches in January. According to CoinGlass, about $900 million in leveraged longs were vaporized. One Discord trader joked, “It was like watching an entire season of ‘Squid Game’ in thirty minutes.”
Why the Market Freaked Out
Geopolitical shocks always hit risk assets first, and Bitcoin, for better or worse, still trades like a tech stock with a mullet. I’m not entirely sure whether the market was reacting to potential energy-price spikes, regional internet outages, or just pure knee-jerk fear. But the chart looks eerily similar to two other “oh-crap” moments:
- March 12th, 2020 (a.k.a. Black Thursday) – BTC nuked 50% in 36 hours, bottoming at $3,850 before its historic rally.
- October 2022 Yen Flash Crash – The yen briefly hit 150/USD, sending BTC down 9% intraday before bouncing 30% over the next ten days.
In both cases, Bitcoin printed a violent wick below the 200-day moving average and then catapulted higher once the news cycle cooled. “Same movie, different popcorn,” as developer
“If the hash rate is healthy and the Fed isn’t actively rug-pulling liquidity, panic dips are just discount coupons,”Jameson Lopp told me on Matrix this morning.
Key Levels I’m Watching—No Crystal Ball, Just Math
I’ve noticed traders obsess over Fibonacci retracements like they’re horoscopes, but I prefer simple horizontal support/resistance. Here’s what my TradingView looks like right now:
- $60,900 – 100-day EMA and the level where MicroStrategy’s average buy-in sits. Saylor memes become reality here.
- $57,000-$58,000 – Confluence of January ETF launch breakout and a fat CME gap.
- $52,300 – Psychological “post-halving cost basis” zone. If we lose this, it’s winter coat time.
On the upside, you’ve got $64,800 (Friday’s breakdown point) and the double-top at $67,000. Closing a daily candle above $67k flips the narrative from “war panic” to “buy the rumor, hodl the relief.”
But Can a Halving Really Save the Day Again?
The fourth Bitcoin halving lands around April 20th—yeah, 4/20 memes already loading. Historically, halvings lag; price fireworks usually happen 6-18 months later. However, on-chain data from Glassnode shows over 70% of BTC hasn’t moved in a year. That’s an illiquid supply crunch lining up with ETF demand from BlackRock, Fidelity, and your uncle’s 401(k) provider.
I think of it like a game of musical chairs where the chairs are bolted to the floor but more people keep entering the room. Eventually, someone pays up or stands forever.
Quick Tangent: Remember the ETFs?
We’re only three months into spot ETF life and IBIT alone is hauling in ~$200 million per day (despite outflows at Grayscale). If those flows stay net positive, they’ll soak up the ~450 new BTC mined daily faster than you can say “To the moon.” That doesn’t guarantee price appreciation tomorrow, but it sets a structural tailwind I can’t ignore.
Risk Factors That Still Keep Me Up at Night
1. Rate Jitters – Powell told us “higher for longer” yesterday. If 10-year yields push above 5%, everything risk-on gets repriced.
2. Crypto Lawfare – The SEC is busy slapping Wells notices like Oprah giving away cars. Coinbase and Uniswap are the latest targets.
3. Liquidity Drains – The Bank Term Funding Program sunsets soon. Liquidity removal could feel like April 2022 all over again.
4. Mideast Escalation – If Iran-Israel skirmish escalates into an energy shock, expect a global flight to cash (and ironically, maybe some gold).
I’m not saying pull the plug on your Ledger, but leave some dry powder. I’ve seen too many traders blow up because they wanted to be “maxi or nothing.”
So, Should You Buy This Dip?
In my experience, buying fear has paid me more often than buying euphoria. I scooped a small bag at $60,900 Friday morning—not a hero trade, just a nibble. If we break below $57k, I’ll add in tranches down to $52k. If we instead reclaim $67k on strong volume, I’ll flip my short-term mindset from cautious to aggressively bullish.
And if I’m wrong? Well, I’ve been wrong before—remember when I passed on ETH at $80 because I thought the DAO hack would haunt it forever? Sometimes the market’s job is to humble you.
Why This Matters for Your Portfolio
You can’t control Middle-East geopolitics, Powell’s caffeine intake, or whether Taylor Swift drops an NFT album tomorrow. You can control your position sizing, your time horizon, and whether you let Twitter FOMO dictate your entries. Bitcoin’s 7% puke looks scary on a one-day chart, but zoom out: we’re still up 50% year-to-date and barely 15% off all-time highs.
Think of the market like surfing. You don’t complain that the wave is too choppy—you adjust your stance and scan the horizon for the next set. If anything, the past 48 hours remind us that volatility is the fee you pay for outsized upside. Whether you’re willing to pay that fee is entirely up to you.
Wrapping Up (I Promise)
I’m cautiously optimistic. The halving, ETF flows, and sticky supply sound like the setup you want heading into summer. But headlines can nuke sentiment in minutes—Covid taught us that. So set your alerts, keep some dry powder, and remember: time in the market beats timing the market, unless you’re a wizard, and you’re probably not a wizard.
Talk soon, keep your private keys safe, and maybe—just maybe—this little 7% scare is the warm-up act before Bitcoin’s next stadium tour.


