We Woke Up to a Market That Finally Blinked
It’s 06:42 UTC and the desk espresso machine is already flashing clean me. Ignore it. ETH just printed three consecutive 12-hour candles that finally threaten the top of this month-long box, so nobody here is stepping away for maintenance mode.
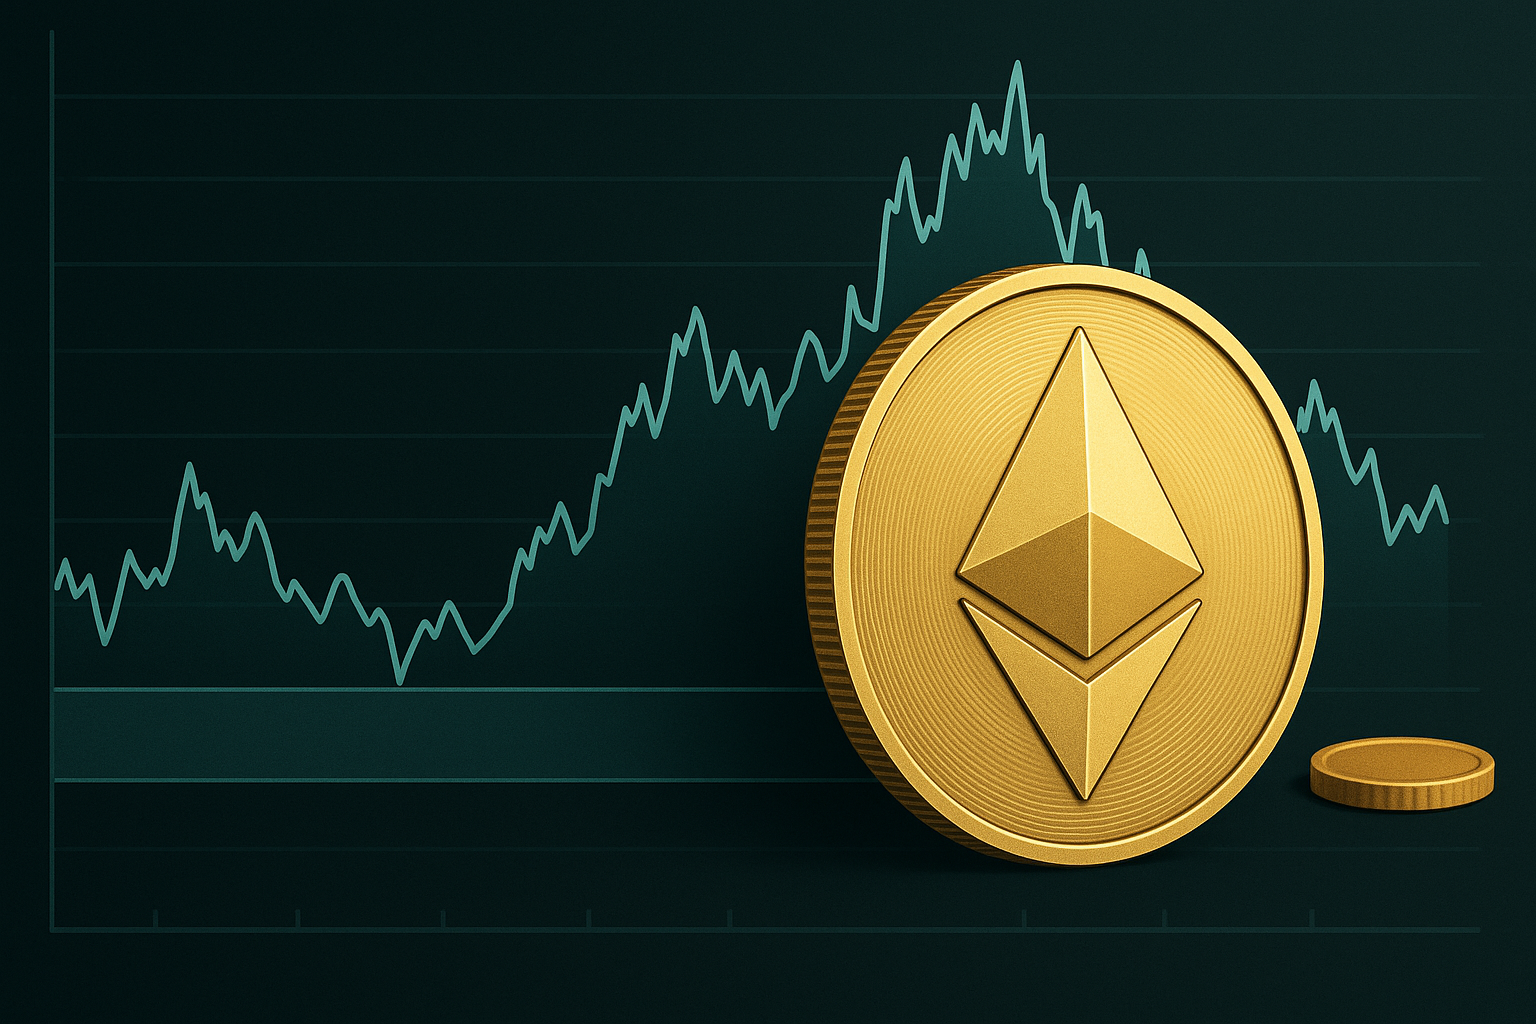
Since the first week of May, Ethereum has traded like a bored teenager, pacing between $2,400 and $2,700. Every time it wandered outside the boundaries, the bouncers (market makers on Bybit and Cumberland) shoved it back in. Overnight we tagged $2,598 on Binance perp—close enough to smell the $2,600 trigger but not close enough for the algo sweepers to declare victory.
Here’s What the Heatmap Isn’t Telling You
Everyone and their cat has screenshot the Coinglass liquidity map: a fat red blob at $2,800 and a slightly skinnier one at $2,350. Obvious magnets, right? Sure—but why do they matter?
- Roughly $480M in cumulative stop liquidity sits between $2,750-$2,820 across Binance, OKX, and Bybit. If the first wick prints above $2,700, quant desks will smell blood and run those stops for breakfast.
- On the downside, a chunky $390M worth of long liquidations cluster from $2,380-$2,320. If bulls whiff here, we could see a flash down to the 100-day EMA at $2,206 before Chicago even pours its first coffee.
Remember 2017? Yeah, That Feel Is Back
I’m not entirely sure we’re replaying the exact script, but the vibe rhymes. Back then, ETH churned sideways at $300 for what felt like eternity. Everyone capitulated to boredom—then BOOM—Thanksgiving came and we were suddenly at $800. The setup now is eerily similar: compression, apathy, then one catalyst away from melt-up.
The difference? Derivatives open interest. Aggregate OI for ETH perps is flirting with $11.5B, up nearly 18% since the May doldrums. Translation: there’s gasoline on the floor; we’re arguing about who lights the match.
Who’s Actually Positioning?
We dug through Arkham flows and spotted at least two wallets many of us suspect belong to Wintermute rotating from SOL and AVAX back into ETH spot yesterday—roughly 23,000 ETH across Coinbase and Kraken. At the same time, Amber Group appears to have sold covered calls expiring July 26 with strikes at $2,800. Either they’re harvesting yield or secretly confident that $2,800 prints, gets nuked by gamma hedging, and they buy the dip. Old Citi guys call that “dropping the anchor, fishing the wreck.”
But What About the Macro Ghouls?
Jerome Powell’s Jackson Hole speech is six weeks out, and CPI just clocked a cooler-than-expected 3.0%. Risk assets cheered, but crypto’s response has been… meh. From where we sit, the market’s basically saying, “Wake me up when ETH ETF rumors resurface.” Gary Gensler is still playing goalie, but word around DC (per Eleanor Terrett’s weekend thread) is that at least one TradFi giant submitted revised S-1 language for an ETH spot fund. If that lands on Bloomberg terminals before we test $2,350, the downside case probably evaporates.
Chart Stuff We’re Actually Watching
"Everyone looks at price; we look at how it’s traded." — old LedgerPrime saying
On TradingView’s 12-hour ETH/USD chart:
- Price hugging the 50 SMA at $2,560; we close above $2,600 twice and quant trend models flip long.
- RSI curling out of a bullish divergence that started June 24 when price made equal lows but momentum printed a higher low.
- Bollinger Bands have compressed to a 4-month low; last time volatility got this tight (Jan 22) we exploded 18% in three sessions.
Translation: a two-way move is coming. We don’t get paid for predicting the coin toss; we get paid for betting the payout skew. Right now the upside still looks slightly fatter.
Okay, So How Are We Trading It?
We sold a partial lot at $2,590 just to pay ourselves for staying awake, but kept a core long. Stops? $2,475 hard stop—no heroics. We also snagged some out-of-the-money August calls at $3,200 for pocket change. If ETH pukes to $2,350 first, we’ll kiss the calls goodbye and layer bids around the $2,200 200-SMA. Risk is defined; sleep is possible. Kind of.
Why This Matters for Your Bags
If ETH goes, it drags the L2 kids with it. ARB, OP, even neglected MATIC charts are all printing higher lows. Glassnode’s Altseason Index ticked 42 yesterday—50 flips it to official “alt season” territory. We’re one ETH breakout away from that threshold. Miss it, and you might spend the rest of summer rage-scrolling X while your friends post beach photos.
Random but Relevant
- OpenSea just integrated Blast L2. If ETH fees spike on a breakout, expect a quick rotation into newly hyped cheap-gas chains.
- Remember when GameStop memes overlapped with Dogecoin pumps? Barbie sequel trailer drops next week—don’t underestimate cultural catalysts for retail FOMO.
- If you’re staking through Lido, watchdog bots show slightly elevated exit requests—probably hedge funds freeing collateral for directional punts. No reason to freak, but worth a glance.
Bottom Line—We’re Watching the Clock
Asia session owned the first poke at $2,600. Now it’s up to New York to either confirm or rug. A daily close above $2,600 targets $2,800 fast; failure likely means $2,350 liquidity gets vacuumed. We’re positioned, but we’re humble. Seen too many perfect breakouts fail because some giga-whale needed to rebalance or, hell, because it was a full moon.
I’d love to declare “up only,” but that’s how you end up staring at the ceiling at 3 a.m. So we’ll stay nimble, keep half an eye on Powell, and the other on Glassnode alerts. Good luck out there—and remember: the market doesn’t care about your beach plans.


