This just hit the tape. Ethereum (ETH) has once again smashed its head against the unforgiving 200-day moving average—right around the $2,600 mark—and, well, it’s not looking pretty.
Here's What Actually Happened
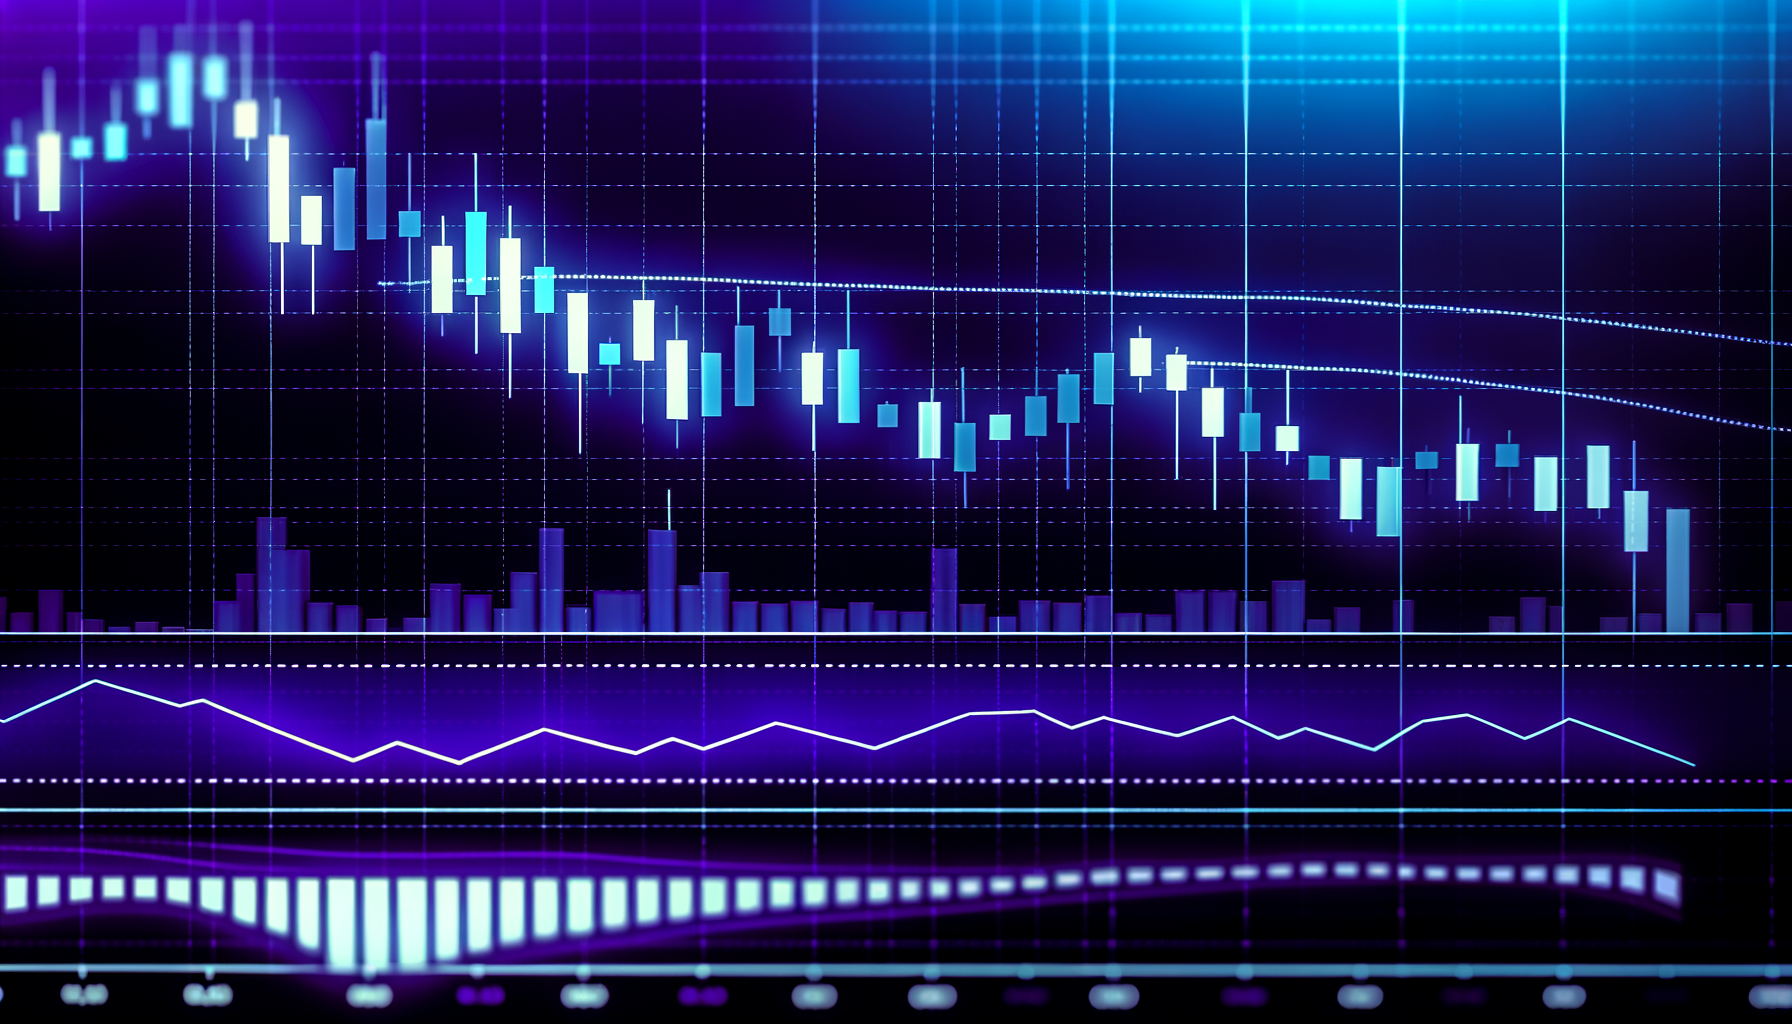
Minutes ago, spot charts on both Binance and Coinbase lit up with red candles after ETH failed to close above that all-important 200-day line. On the daily chart, the level sits at $2,602 (give or take a few bucks depending on your exchange), and the market treated it like an electric fence. Rejected. Again.
The rejection isn’t some isolated blip either: volume on the failed breakout ticked up to 28% above the 30-day average, signaling that big players—most likely the same whales everyone’s been tracking on Nansen—are unloading. I’m not entirely sure if they’re done yet, but the distribution phase looks alive and kicking.
Why This Matters for Your Portfolio
The 200-day MA isn’t just a random squiggly line. Most algos and a lot of human traders key off it to decide if we’re in a bull or bear regime. ETH has been pinned beneath that moving average since mid-April, and today’s flop screams, “Bears still in charge.”
RSI on the daily is flirting with 48—below the 50 neutral line—and MACD just printed its second straight red histogram bar. That combo rarely ends with a moonshot. If anything, we could be looking at a swift drop toward the $2,300–$2,350 support zone, where the 100-day MA is chilling.
Okay, But Can the Bulls Pull a Rabbit Out of the Hat?
Sure, anything’s possible in crypto—remember when Dogecoin ran 8,000% in 2021 on nothing but Elon tweets? But right now, the order book depth on Binance shows asks stacked two-to-one over bids between $2,580 and $2,620. That’s not bullish; that’s a brick wall.
Unless Vitalik swoops in with a surprise EIP that burns half the supply—hey, stranger things have happened—bulls look cornered. Even Arthur Hayes chimed in on X earlier, joking, “Wake me up when ETH reclaims $3K.” Ouch.
Now Here's the Interesting Part
Derivatives data on Coinglass reveals funding rates sliding toward neutral from last week’s mildly positive prints. That hints at longs backing off—not exactly the vibe you want heading into the weekend when liquidity gets thinner than a Solana validator uptime promise (sorry, had to).
Open interest, though, still hovers near a one-month high. To me, that sets up a delicious scenario for a long squeeze. If ETH loses $2,500 convincingly, we could see cascading liquidations flush us straight into the low $2,300s. That might be the level where dip-buyers, the same degens who love catching falling knives on Uniswap, finally step in.
Quick Tangent: Layer-2s Aren't Helping
Some folks argue that rollups like Optimism and Arbitrum absorb a chunk of speculative capital that would have pumped ETH’s spot price. I’m not here to say they’re wrong, but the correlation feels weak. Still, if capital’s splintered across L2 ecosystems, that could explain why ETH can’t find enough bid support above the 200-day.
What I'm Watching Over the Next 24 Hours
- $2,500 psychological line: We lose that, say hello to $2,300 real fast.
- Funding rates on Bybit: If they flip negative, buckle up for a liquidation fiesta.
- Stablecoin inflows: USDT and USDC transfers onto exchanges will tell us if sidelined cash is ready to pounce. So far? Crickets.
- Gas fees: A spike often precedes frenzied spot buying, but gas is a sleepy 16 gwei. No FOMO detected.
So, What's the Move?
If you’re a hardcore trader, tight stops are non-negotiable here. A lot of folks are eyeing a 7–10% pullback, and honestly, that’s not even dramatic in crypto land. Swing traders may want to wait for a cleaner setup—preferably a bounce off $2,300 with volume confirmation. If you’re a long-term holder, you already survived the 2018 meltdown, so this is just Tuesday.
Caution isn’t cowardice—it’s capital preservation. No shame in sitting in stables until the chart stops bleeding.
One last thought: ETH staking yields keep grinding higher as more ETH exits CEXs and enters staking contracts. Long term, that’s bullish. Short term, though, supply on exchanges dwindles after people buy, not before. So the immediate tape still rules the day.
Final Word—Don't Let the Chart Own You
This market moves fast. By the time you finish reading, we could already be testing $2,480—or miraculously reclaiming $2,600. Keep alerts on, hydrate, and maybe don’t trade from your phone while you’re in line for coffee. Retails blow accounts doing that stuff.
Stay nimble, stay skeptical, and as always—use a damn stop-loss.


