My phone buzzed at 3:12 a.m. — one of those half-asleep pings you either love or hate depending on what’s happening in the market. It was an old buddy from my 2015 Poloniex chat-room days texting, “Dude… XRP’s waking up.” I’d heard the same line in 2017, 2020, and again in 2021. Most of the time it fizzled. But every once in a blue moon, XRP actually follows through. So I rolled out of bed, fired up the Kraken chart, and there it was: a clean break above $2.20.
Here’s What Actually Happened
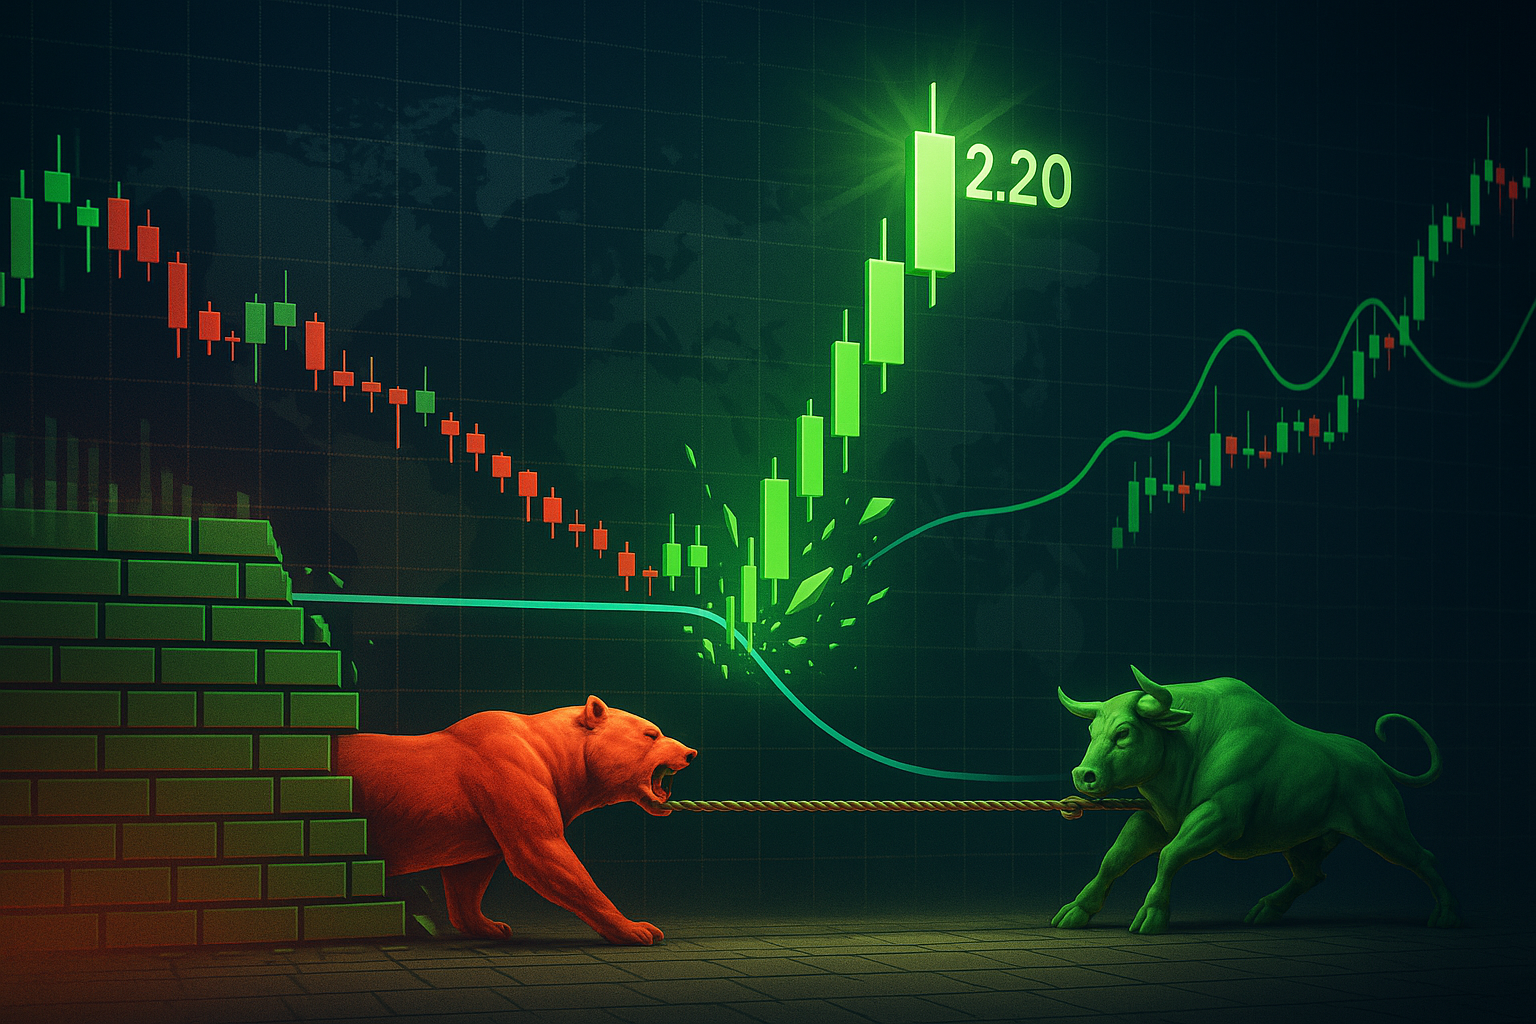
Hours earlier, XRP carved out a tidy base just shy of $2.08. The bears tried to dunk it lower, but the order books looked like a brick wall — reminded me of December 2017 when Ripple’s bids wouldn’t budge no matter how much FUD was flying on Twitter. Then, as Asia opened, the price punched through $2.12, cleared $2.15, and smashed a nagging bearish trend line at $2.19. That breach felt significant; nothing fancy, just a single hourly candle with volume spiking 35% above the 20-day average.
Right after the break, the market printed a local high at $2.2191. Yeah, I know, that extra fourth decimal looks goofy, but Kraken’s book can be a quirky beast. Since then we’ve pulled back a hair — flirting with $2.18 — yet we’re still parked above the 100-hour simple moving average (SMA). For short-term traders, that SMA at $2.15 is now the line in the sand. Flip it into resistance? We’re back to our regular schedule of sideways misery. Hold it? We have room to gun for $2.32.
Why This Move Feels Different (But Could Still Fake Us Out)
I’ve been through more XRP rallies than I care to admit. The token loves a good head-fake, especially when the broader market’s distracted. Remember September 2022? CPI numbers tanked BTC and ETH, yet XRP squeezed 30% in two days on nothing but courtroom tea leaves. This current setup, though, has actual technical meat on its bones:
- The Hourly MACD is finally riding above the zero line with a widening histogram. Last time we saw that was mid-March, and XRP added 18% before cooling.
- RSI is hanging around 58–60 — bullish, but not yet nose-bleed territory. Translation: there’s still gas left in the tank.
- Volume on Kraken and Binance is up roughly 28% versus the 7-day average. Market makers can spoof, sure, but sustained volume usually tells the truth.
On the flip side, I’m keeping a cautious eye on that $2.22–$2.25 supply pocket. There’s clustered sell pressure dating back to January highs, and if history rhymes, sharks will dump into strength right at that band. We clear it with conviction? I’ll happily admit I was too conservative.
The Bigger Picture — And a Quick Walk Down Memory Lane
Back in the summer of 2017, XRP pulled off one of the nastiest fakeouts I’ve ever traded. Price blasted from $0.24 to $0.39, Twitter was chanting “$1 soon,” and then — splat — we sank to $0.16 in three weeks. Traders who chased the green candles got torched; those who waited for confirmation at the prior high made out like bandits in December when XRP rocketed to $3.84. The moral? Momentum without follow-through is just noise.
Fast-forward to today, macro conditions are light-years away from the ICO boom. We’ve got active TradFi players; we’ve got the never-ending SEC lawsuit (don’t even get me started); and we’ve got real utility chatter around Ripple’s ODL corridors. Does any of that fundamentally demand a $2.50 XRP? Maybe, maybe not. But the chart is suggesting traders believe a narrative again, even if only for a swing trade.
Numbers You Shouldn’t Ignore
Here’s my quick-and-dirty cheat sheet I keep taped to my monitor:
Immediate resistance: $2.22
Major resistance cluster: $2.25, then $2.32
Moonshot line: $2.40 – $2.45
Immediate support: $2.18
Break-even stop (short-term): $2.1450 (50% Fib retrace)
Last-ditch support: $2.08
If we decisively pop $2.32, my eyes jump straight to $2.40, where I see a chunky long-term horizontal level and an options wall on Deribit. A daily close above that, and suddenly everyone still coping with their 2021 bags will be tweeting laser-eyes again. Unrealistic? Sure. Impossible? Not in crypto.
What the Crowd Is Saying
Scanning X (formerly Twitter) at dawn is dangerous for your sanity, but useful. @Kaleo is chirping about an “altcoin reprise,” while @Crypto_Bitlord claims he’s “all-in XRP” — grain of salt there; he says that every quarter. Over on TradingView, the top-liked chart by user MagicPoopCannon (yes, still around) argues we’re forming a classic ascending triangle with a theoretical measured move to — you guessed it — $2.50. I’m not entirely sure about the neat geometry, but triangles tend to end violently one way or the other.
How I’m Playing It
In full transparency, I grabbed a starter position at $2.16 with a tight stop just under $2.14. If we close an hourly candle above $2.25, I’ll add. If, instead, we stuff the wick and slump below $2.18, I’m out. Simple as that. This isn’t marriage; it’s speed dating.
Long-term investors — the so-called XRP Army — have a totally different calculus. They’re betting on regulatory clarity and cross-border payments dominance. For them, these micro swings are background noise. But for short-term momentum chasers, precision matters. Don’t let hopium blind you to a 7–10% drawdown just because a YouTuber said “the chart looks juicy.”
Why This Matters for Your Portfolio
If you’re heavy BTC or ETH, a pocket of altcoin strength can be a welcome uncorrelated hedge. Historically, when BTC chops sideways (we’re stuck around $71k as I write), traders seek action in mid-caps like XRP. Just remember the golden rule: liquidity thins out fast once narratives change. Set alarms, use stop-limits, and don’t chase green candles after five consecutive hourly up bars.
Also worth noting: ISO 20022 chatter is back in banking circles after the ECB’s recent update. Whether that tangibly impacts XRP this month is debatable, but mainstream headlines tend to magnetize retail FOMO. Keep an eye on Google Trends for “Ripple banking news.” If that spikes while price rips, you’ve got combustible fuel — and a timer.
Parting Thoughts from Someone Who’s Been Smacked by This Chart Before
Back when I burned my eyebrows off in the 2018 altcoin winter, a grizzled futures trader told me: “You don’t need to catch every wave, just the ones that won’t drown you.” That line’s saved me more fiat than any indicator. XRP’s current push over $2.20 looks promising, no doubt. But if it stalls under resistance, step aside. There will always be another setup. That’s the beautiful — and brutal — rhythm of crypto.
For now, I’m keeping my surfboard waxed and my stop-losses tighter than a ledger seed phrase. Let’s see if the bulls have the legs to sprint past $2.25. If they do, I’ll meet you at $2.40. If not, well… there’s always the next token awakening at 3 a.m.


